Decarbonization Decoded.
Integrated Platform for Cost-efficient and Carbon-driven Retrofits
At Enverdex, we’ve developed a smarter way to plan building retrofits.
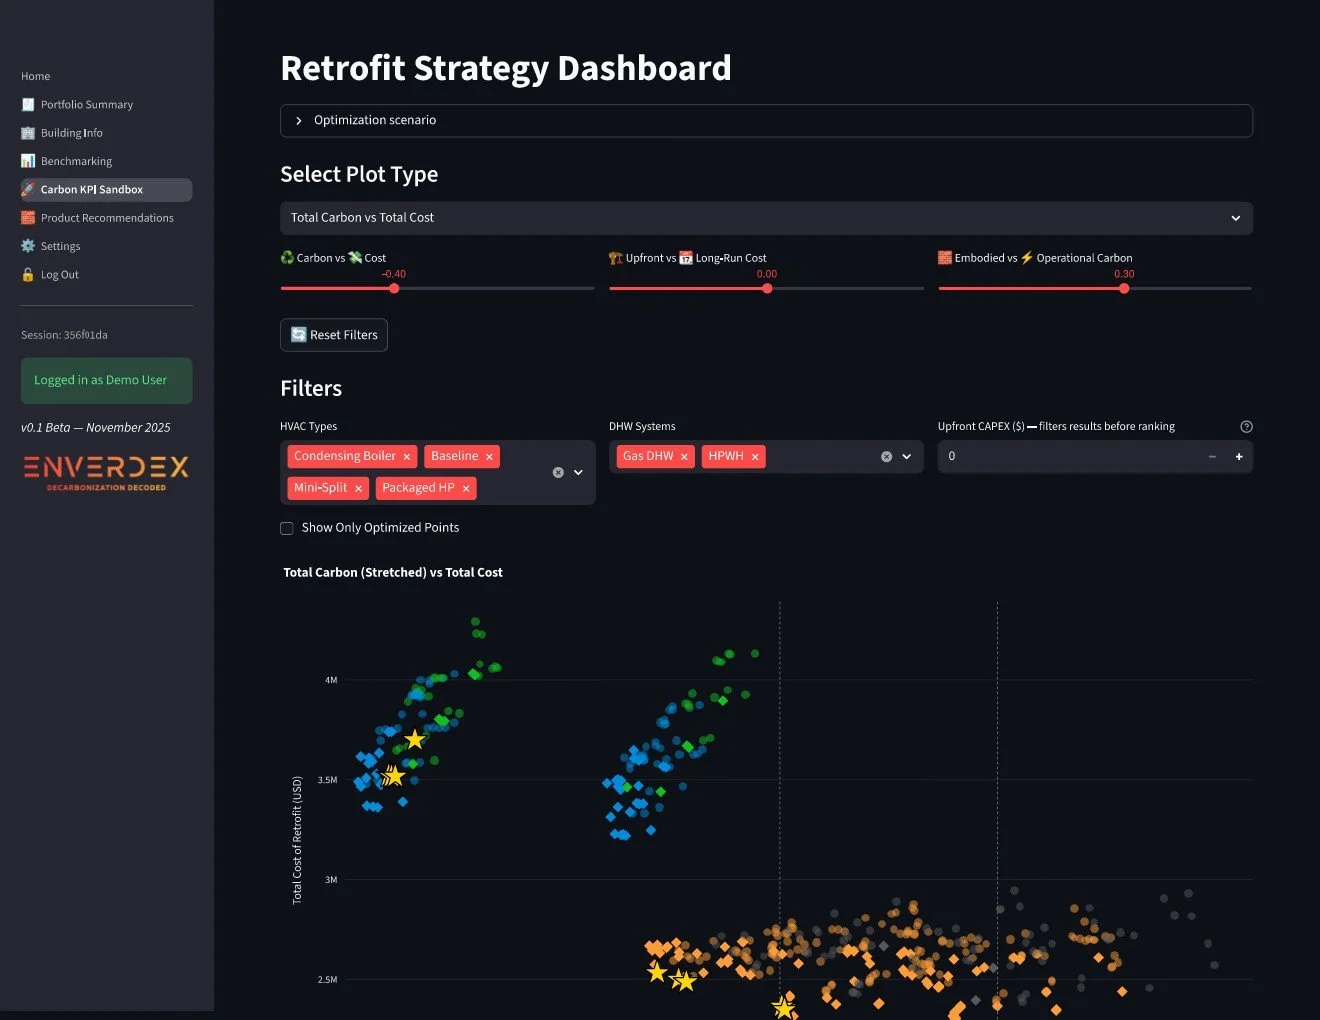
Our Praevion engine simulates and evaluates thousands of retrofit combinations—so you don’t have to.
Using city-specific data, building physics, and advanced optimization techniques, we help you find the sweet spot between carbon savings, cost efficiency, and regulatory compliance.
Data-driven retrofit strategies without manual energy modeling
Insights that balance operational carbon, embodied carbon, and cost
Compliance-ready recommendations tailored to local building policies
Scalable optimization built for portfolios, not just individual buildings